


![]()
This article is from old notes I need to tidy up soon...
In the frontier days of radio communication, just getting a message sent at all was the prime directive. Early methods were crude by today’s standards, occupying bandwidths from DC to daylight just to send a simple binary Morse code message at as little as 12 words per minute, i.e. about one bit per second. The maritime industry in particular had an immediate need to send distress messages over long distances, and at the time, few additional services required use of the same radio resource, or if they did, the purpose of the distress signal would outweigh the simultaneous spectral use by any other party.

However the days of “spark gap” transmitters and “coherer” receivers are long gone, and with the advent of the radio Valve, it became possible to transmit energy on a single radio frequency, rather than as a continuous spectrum of on and off noise. This allowed the transmit energy to be concentrated into one narrow channel rather than spread out all over the show. It also allowed more sensitive receivers to be constructed, and more importantly, selectivity, or the ability to differentiate between signals on different frequencies, became possible.
The first transmitters and receivers used Amplitude Modulation (AM) to convey messages, and for the first time actual voice and music communication became possible. In addition, the technology was now within the reach of the consumer, and the golden years of Broadcast radio began.
However the technology, by today’s standards, still remained crude. Tuned Radio Frequency (TRF) receivers were the main fashion statement in the world of radio, and relied on the Q of either one or several tuned circuits to provide rejection to unwanted, off channel signals. Positive feedback (called “regeneration” or “reaction” in those days) was often used to increase Q and hence reduce bandwidth, and had the added advantage of increasing sensitivity. However the general public had great difficulty manipulating a positive feedback control (that’s why all those old sci-fi movies show whistling radios tuning in a signal – they were unstable!) along with multiple tuning controls, RF Gain and Audio Gain. Hence the seeds for the invention of the Superhetrodyne (or just Superhet) receiver were sown.
The superhet receiver uses the method of frequency conversion to direct the required signal to a fixed intermediate frequency amplifier stage, which supplies the dominant amplification and selective filtering. This produced an easy to use radio with superior performance. Moore importantly it allowed migration to higher frequencies, which were harder to process with the Valve technology of the time. The superhet radio required only one Valve to work at VHF and above, all other Valves could work at lower frequencies.
During this era, the “spectral efficiency” of AM had matured, at least for medium wave frequencies (550 KHz to 1.6 MHz), and radio’s with IF bandwidths as low as 8 kHz were feasible. This would allow more than 100 broadcast channels at 10 kHz spacing to fill up the allocated medium wave spectrum. However the wide frontiers of VHF remained and people soon realised the massive increase in available spectrum that could be exploited. Spectral efficiency was no longer a concern, having moved away from the jam-packed medium wave bands. This was the birthplace of mobile radio, and especially Private Mobile Radio (PMR) which we participate in today.
Police and ambulance services all had need for remote communications on the run, and whatever technology would fill the bill was just dandy. Unfortunately Valves were not cheap and emergency services still ran on a budget, so “rough and nasty” technologies were needed to realise the dream. This is from were the “Super-regenerative” receiver or “rush box” came. This technology, still used in cheap garage door opener receivers, consists of an oscillator that is turned on and off at an ultrasonic frequency, usually between 20 kHz and 100 kHz. If a signal is present the oscillations build up more quickly than from thermal noise alone, and the average current increases. This increase in current becomes the demodulated audio output, and AM reception is possible.
The super-regenerative receivers of the 1940’s etc had good sensitivity for a single valve implementation, and could receive signals down to several microvolts at VHF. An equivalent diode detector (“crystal” set or “grid leak”) required signals in the order of 10 to 100 millivolts for comparison. However the available selectivity was poor, and bandwidths around 1 MHz were common, even though the modulation bandwidth might only be 3 to 5 kHz. However the prime archille’s heal was their persistent background roar that remained until a signal was received. Although emergency workers such as police and ambulance might be expected to tolerate this nuisance in the background, all day and every day, the taxi faring populace would not. Once again the motivation to go superhet emerged.
It might seem that we are going a long way with the history of AM, but this is just to demonstrate that the scarcity of a resource dictates the technology that can best exploit it. The broadcast public, feed on long dreary programs on AM began to feel that entertainment should become an ambition. They began to want high quality audio for music and the current AM medium wave channels had reached saturation with a raster of narrow band channels shoulder to shoulder at 10 kHz spacing. High quality audio would require frequency content up to 16 kHz or higher, and for AM technology, a transmission bandwidth of 32 kHz would be needed to convey this. The old medium wave band just didn’t wave wide enough doors left for this.
Now the theory of Frequency Modulation (FM) had been known since 1922 but it was not until E. H. Armstrong presented his IRE paper in 1936 on “A method of reducing disturbances in radio signalling by a system of frequency modulation”, that significant commercial interest was aroused. The FCC soon announced an allocation of 40 channels ranging from 42 MHz to 50 MHz, for FM broadcast based on channels 200 kHz wide with 75 kHz peak frequency deviation.
Now the prime directive had become “quality of service” rather than spectral efficiency, given that 200 kHz is much wider than hat required for an equivalent AM transmitter with increased modulation bandwidth. FM was claimed to have much better resistance to impulse noise, lower distortion, place less demands on RF power amplifier Valves (due to its constant envelope) but the biggest porky told was “capture effect”.
Armstrong argued that the output of a FM demodulator could have a significantly better Signal to Noise Ratio (SNR) than the SNR at the input. The claim was the “limiter” amplifiers in the IF chain would remove AM noise, and providing that a wanted signal was above a certain threshold, the receiver would “capture” the stronger signal in preference to the weaker one, or noise itself. This actually does not occur, and FM receivers do not magically “clean up” a signal as had been claimed. However the audio filtering alone plays a significant role. First the audio bandwidth might only be 16 kHz, much lower than the RF bandwidth of 200 kHz. By removing high frequency noise through audio filtering, an improved SNR will result. In addition, “pre-emphasis” is used on transmit, and this boosts high audio energy. On receive this boosted energy is attenuated back to result in overall “flat” audio response. However the receiver noise is also attenuated at higher audio frequencies, and this sounds less objectionable to the human ear. The result: Joe public gets their broadcast music and Armstrong gets a few brownie points for his part in the play.
The PMR business has fared well on the back of narrow band Analog FM for general voice based communications between users on a private network. Although not the most spectrall efficient format, requiring 12.5 kHz channel spacing in order to support a 300 Hz to 3 kHz audio voice bandwidth, it is easy to produce, demodulate and has been well supported by component manufacturers and their device offerings. However the current plans are to migrate all PMR users to a 6.25 kHz channel plan, and conventional narrow band FM will be stretched just a little bit too far in doing this.
These days, Digital modulation formats are replacing older Analog formats in almost every area of radio communications. These formats allow the maximum possible use of available bandwidth and are general enough to support the conveyance of many divergent media types such as voice, data, music, graphics and movies. This functionally could never be realised in the Analog domain.
The down side is that Digital implementations can be a lot more complex and sophisticated than the old “cat’s whisker” crystal set. However the semiconductor technology is ready to support the demand for Digital. Propped high on the shoulders of ever shrinking geometries, increased device integration and speed some of our world’s greatest minds are even today solving the riddles that Digital technology proposes.
Digital modulation formats often use an “IQ” signal representation in order to represent a given modulation scheme. However this can appear abstract at first, so this document will address this.
We will consider a circuit implementation of a IQ modulator based on two DBM mixers, a 90 degree phase splitter and an in phase combiner.
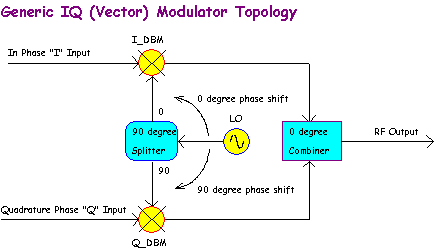
Note that there are two possible inputs called I and Q, one Local Oscillator input and one RF output. When the I and Q inputs are zero volts, the RF output level will also be zero due to the balanced nature of the DBM (given perfect mixers). As the inputs are increased, the RF level from each mixer will also increase. In addition the output phase, relative to each mixer LO input will be determined by the polarity at each input.
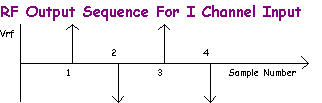
Imagine that the I input receives the following sequence +1 V, -1 V, +1 V, -1 V and the Q input remains at zero volts, so it contributes nothing to the output. We would represent the RF output sequence as,
|
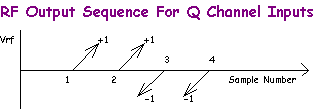
Now we will repeat the experiment for the Q channel, but keep I = 0 V. This time we will use the sequence +1 V, +1 V, -1 V, -1 V. We would represent the RF output sequence as,
|
Unfortunately we do not have any 3-D paper down at the corner store, but we can still see the four possible “states” that can be sent by superimposing the previous two examples
|

In this example we have constructed a QPSK “constellation” with 2 Bits Per Hz “spectral efficiency”.
In the previous example we sent the following sequences
I: +1, -1, +1, -1
Q: +1, +1, -1, -1
We went this using 4 test vectors or “symbols” corresponding to
IQ [+1, +1], [-1, +1], [+1, -1], [-1, -1]
If this sent down a single channel we would have had to sent the following,
Data +1, +1, -1, +1, +1, -1, -1, -1
i.e. 8 Symbols, as opposed to 4. For a given Symbol rate, this means our data throughput is halved compared to the QPSK case.
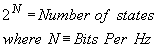
As seen, the way the data is grouped determines the spectral efficiency. For example, say we have grouped the data in threes, i.e. [+1, +1, -1] , [+1, +1, -1], ... This would allow use to send 3 times the data compared to a single Data sequence. However we would have 8 individual states corresponding to each triplet,
000, 001, 010, 011, 100, 101, 110, 111 = 8 possible combinations. This leads to an important relationship
 ...(1)
Note: Conventional comparisons always compare a given formats “Bits Per Hz” to be that relative to what could be achieved using a simple binary sequence within a given transmission bandwidth. For example, a bandwidth of 8 kHz can only support a binary symbol rate of 8 kSymbol/s and has only 1 Bit/Hz spectral efficiency. Its data rate is therefore 8 kB/s. If QPSK was used this would double to 16 kB/s, but the symbol rate would stay the same.
Example
Data Rate vs Constellation Size
|
Modulation
Format |
Bits/Hz
= N |
States
= 2^N |
Symbol
Rate |
Data
Rate |
|
Binary Data |
1 |
2 (+1, -1) |
8,000 |
8,000 |
|
QPSK |
2 |
4 |
8,000 |
16,000 |
|
8-PSK |
3 |
8 |
8,000 |
24,000 |
|
QAM16 |
4 |
16 |
8,000 |
32,000 |
|
QAM32 |
5 |
32 |
8,000 |
40,000 |
|
QAM64 |
6 |
64 |
8,000 |
48,000 |
|
QAM128 |
7 |
128 |
8,000 |
56,000 |
|
QAM256 |
8 |
256 |
8,000 |
64,000 |
In the previous table we showed a number of possible “constellations” and their relationship to spectral efficiency. If we want to make better use of an available channel bandwidth, (which limits the maximum rate at which we can update a transmit “symbol”) we need to increase the number of Bits Per Hz (a measure of “spectral efficiency”). To do this we need more dots on the IQ plane. Let us consider the case of 8-PSK (8 level phase shift keying)
|

If the incoming data is unfiltered, then the transitions will be instantaneous, i.e.
|

Conventional wisdom suggests that the I and Q signals are low pass filtered prior to the IQ modulator in order to reduce the unnecessary spectrum that would otherwise occur. Note that although Digital modulation schemes are said to be “spectrally efficient” this does not mean that they are “spectrally clean”. For example, the bulk of the information may fit within a given spectral mask, this does not mean that adjacent spectrum users would not experience unwanted interference. A typical unfiltered Digital spectrum would look like this,
|

In Digital systems it is customary to “match” the filter characteristics to the symbol rate. This is to ensure that the filter “rings” in sync with the modulation in a predictable fashion. At certain critical time positions, the effect of the filter is removed, so that the exact position of the constellation point can be measured.
The effect of any filter is to delay and modify the path between constellation points, so the result depends on the previous starting position. This is called “Inter Symbol Interference” meaning that previous history modifies the result. Most Digital Systems attempt to remove inter symbol interference but can only do this at certain critical time instances between transitions. The result of this can be visualised in an “eye diagram” as shown below.

This eye diagram shows an unusual form of 4 level FSK with 7 apparent vertical “eyes”. In these regions there is no confusion over what the value of the symbol was. The eye diagram shows transitions overlaid from all constellation start positions to all destination positions from one symbol to the next. Note that it is impossible to tell what value the symbol was at p=8 on the x axis. This is because inter symbol interference has corrupted the symbol value. However at p=4 and p=12 the result is obvious.
To further increase spectral efficiency more dots are needed on the IQ plane. A typical approach is to use QAM – “Quadrature Amplitude Modulation”. The same IQ architecture is used, and dots are added in the form of a square.
|

The most common analog modulation format is good old FM. However this is suitable for voice traffic, but sending music would be a disaster. Further, trying to send a TV picture over a PMR 12.5 kHz channel would be a mission.
However a digital variant of FM, called M-FSK is popular. This format uses dots in frequency displacement to represent information.
|
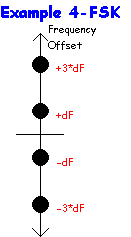
One property of M-FSK, common to FM, is that its envelope power is constant with time. In other words its IQ “constellation” is a circle with constant radius (i.e.amplitude).
|

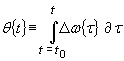
Expressed mathematically we have
|
![]() ...(2)
...(2)
where
![]() is in radians and
is in radians and
![]() is in radians per Hz. To convert to
more familiar cycles per Hz we need to multiply the result by 360/(2*pi).
is in radians per Hz. To convert to
more familiar cycles per Hz we need to multiply the result by 360/(2*pi).
Ok, so how do we generate a constant amplitude IQ signal? One approach is to use a sine and cosine Look Up Table (LUT) for I and Q signals.
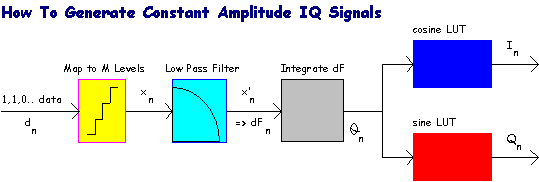
Since
![]() then
then
 . Once the data is mapped into the required levels corresponding to required
frequency offsets
. Once the data is mapped into the required levels corresponding to required
frequency offsets
![]() , it is then low pass filtered and integrated to produce an equivalent phase
angle
, it is then low pass filtered and integrated to produce an equivalent phase
angle
![]() . This value is passed to the sine/cosine LUT to produce I and Q signals at each
sample n. The result is constant amplitude because,
. This value is passed to the sine/cosine LUT to produce I and Q signals at each
sample n. The result is constant amplitude because,
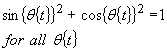 ...(2)
The formula
 represents a continuous time
transformation from a target frequency offset
represents a continuous time
transformation from a target frequency offset
![]() and its associated time varying phase
and its associated time varying phase
![]() (note the dummy time variable
(note the dummy time variable
![]() is replaced with t). However DSP
devices only operate in discrete time steps so an approximation is needed. The
easiest approach is to replace the continuous integral with a summation,
is replaced with t). However DSP
devices only operate in discrete time steps so an approximation is needed. The
easiest approach is to replace the continuous integral with a summation,
 ...(3)
The typical digital representation of this operation is,

A one sample time delay (z^-1) is used to add a previous value to a new input number.
![]()
IQ signals are often represented in the complex plane as this format often results in elegant mathematical relationships. The I axis is represents real numbers and the Q axis represents imaginary numbers
 ...(4)
In this representation, the sine/cosine LUT can be written
 ...(5)
where R is some amplitude scaling term. To convert this to a real RF signal we multiply by another complex exponential,
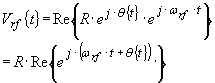 ...(6)
which represents a phase modulated RF
signal with a carrier frequency of
![]() . If the phase modulation
. If the phase modulation
![]() had been derived from frequency
modulation information, then equation (6) would represent an FM signal. This
frequency up conversion can also be demonstrated with sine and cosine
multiplication, by using a lot more trigonometry.
had been derived from frequency
modulation information, then equation (6) would represent an FM signal. This
frequency up conversion can also be demonstrated with sine and cosine
multiplication, by using a lot more trigonometry.
For those interested in additional mathematics, please refer to the appendix heading “Complex Frequency Modulation Theory”. This representation places FM in the complex plane and treats it in real and imaginary parts. (Hence the vertical FSK dots previously)
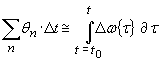
Orthogonal Offset Frequency Division Multiplex (OFDM) is a process that sends multiple symbols effectively in parallel, each on a different frequency sub carrier over the duration of a transmission “group”, as opposed to the more common time sequence of symbols. This strategy provides greater resilience to short term fades over the transmitted period, as the effect is a reduction in SNR for all symbols, as opposed to a complete error in one or more symbols.
OFDM is first constructed as a sequence
of sub carrier symbols
![]() that take on particular values
mapped from the incoming data. In the frequency domain each symbol is
represented as a complex quantity defined as
that take on particular values
mapped from the incoming data. In the frequency domain each symbol is
represented as a complex quantity defined as
 …(7)
…(7)
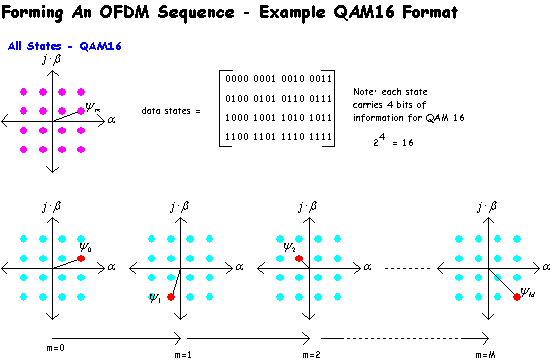
The sequence is constructed from M+1
samples and then transformed using a Inverse Discrete Fourier Transform (IDFT)
into a time domain representation. The time domain sequence contains up to M+1
equal spaced sub carriers that become transmitted in parallel for the duration
![]() of the IDFT sequence. In this case
all sub carriers (symbols
of the IDFT sequence. In this case
all sub carriers (symbols
![]() ) are transmitted at the same time, but on different frequencies due to the
IDFT.
) are transmitted at the same time, but on different frequencies due to the
IDFT.
 …(8)
…(8)
Note that although the transmitted
sequence is a time domain sequence, there is no one to one correspondence
between
![]() and
and
![]() . “Interleaving” is a related process, but this has a direct one to one
correspondence, rather than a distributed one.
. “Interleaving” is a related process, but this has a direct one to one
correspondence, rather than a distributed one.
Let us consider a single sub carrier
![]() and
and
![]() . This will produce a single complex exponential time domain IQ signal after the
IDFT,
. This will produce a single complex exponential time domain IQ signal after the
IDFT,
Now lets change the sub carrier’s
symbol to
![]() - this results a 180 degree shift
in the time domain signal i.e.
- this results a 180 degree shift
in the time domain signal i.e.

The time domain waveform can be shifted
by any angles in-between and / or scaled in magnitude depending on the sub
carrier symbol
![]() .
.
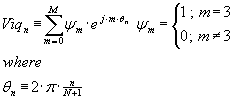
Simply superimpose different integer related frequencies on top of each other up to the number of sub carriers used. These can be represented by the summation
 …(9)
…(9)
Typically
![]() and the total number of frequency
domain sub carriers equals the number of time domain samples =
and the total number of frequency
domain sub carriers equals the number of time domain samples =
![]() . This new complex quantity is then transmitted as if a QAM style I+jQ signal,
and converted back in the receiver using a Discrete Fourier Transform (DFT) to
create a sequence of the original sub carrier symbols.
. This new complex quantity is then transmitted as if a QAM style I+jQ signal,
and converted back in the receiver using a Discrete Fourier Transform (DFT) to
create a sequence of the original sub carrier symbols.
Complex exponential sub carriers are used to allow positive and negative frequencies prior to conversion up to RF by an IQ modulation process (Digital or Analogue). The positive frequencies map to offsets above the carrier, and negative frequencies map to offsets below the carrier. The zero frequency term at m=0 falls on the carrier. The relative offsets are
![]()
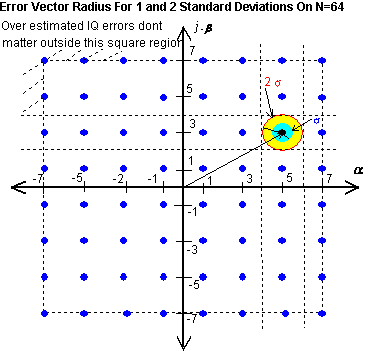
So far everything about Digital modulation seems like the bees knees, but it is not without its technical difficulties. As the constellation is made larger to increase spectral efficiency, the dots become closer together. Small errors therefore influence the position estimate.
|
The RMS noise voltage is equivalent to one standard deviation If the standard deviation was equal to the distance between adjacent decision thresholds, then the decision would be correct 67 % of the time. In other words it would be wrong 33 % of the time (Bit Error Rate “BER” = 33%). If the noise was reduced so that the distance between adjacent decision thresholds was equal to two decision thresholds, then the BER would be 5 %.
Now what do we use as the relative
amplitude to make a Signal To Noise comparison? The symbol values shown are +/-
1/3 and +/-1 (so that the equal separation is 2/3). Now the peak to peak
distance is 2 which has an RMS value of
![]() . For a BER=5%, in this example, the RMS noise voltage (i.e. SD) would need to
be ½ the symbol spacing for 2 * SD to equal this distance. Therefore the
required SNR would be
. For a BER=5%, in this example, the RMS noise voltage (i.e. SD) would need to
be ½ the symbol spacing for 2 * SD to equal this distance. Therefore the
required SNR would be
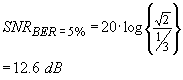 ...(10)
for four constellation points. However note that over estimated errors on the two constellation points are “don’t cares” as they would just be interpreted as +1 or –1. Therefore the real BER probability will be lowered by a factor of 6/8. In general,
 ...(11)
where M = the number of points on I or Q axis’
Summary
Between Constellation Types
|
Format |
SNR
@ 5% |
Corrected
BER |
Comment |
|
BPSK |
3 dB |
2.5 % |
M = 2 – actually can work below 0 dB ! |
|
QPSK |
3 dB |
2.5 % |
M = 2 * 2 – I and Q are independent |
|
QAM16 |
12.5 dB |
3.75 % |
M = 4 * 4, ratio is 1/3 (same as 4 – FSK) |
|
QAM256 |
26.5 |
4.68 % |
M = 16 * 16, ratio is 1/15 |
|
QAM1024 |
32.8 dB |
4.84 % |
M = 32 * 32, ratio is 1/31 |
Note that 4 – FSK requires the same SNR as QAM16 but has only ½ the spectral efficiency! This is because only one component is used whereas QAM has independent I and Q components available.
As shown previously, the position of the “eye” is important to data recovery. As the size of the constellation increases this accuracy becomes even more critical. Mobile applications are severely constrained by this requirement as changing propagation paths cause the signal on the IQ plane to expand, shrink and rotate in an unpredictable manner. FSK system are less affected by this as FM is unaffected by amplitude variation, and modulation is carried by the rate of phase change with time, as opposed to an absolute phase position as in QAM. For this reason, FSK is very attractive for mobile communication.
A similar advantage is possible with QPSK by “differentially” encoding I-Q transitions. In this case, the data is determined by the position of the new IQ endpoint, compared to the previous. This helps avoid the need to track absolute phase, as only relative phase information is required. TETRA, for example uses this scheme (DQPSK). The down side is that a 6 dB SNR penalty occurs, and also high order constellations such as QAM cannot be successfully encoded differentially. Current digital modulation formats used for mobile communications are typically limited to a spectral efficiency of 2 Bits/Hz, unless some new technique for fast IQ stabilization and timing recovery is invented.
Digital systems typically low pass
filter their IQ baseband signals to remove unwanted information and to restrict
interference to nearby channels. These filters “ring” at the symbol rate,
causing overshoot. Also the
![]() energy overshoots between
transitions, causing large envelope variations. A given schemes peak to average
ratio or “crest factor” can vary from 0 dB (FSK) to > 10 dB for QAM and
OFDM. If the IQ filter frequency roll-off is made “sharper” in order to
minimise adjacent channel power, then the peak to average power ratio increases.
Most QAM systems used “root raised cosine” filters on the I and Q channels.
These are designed to have a –3dB corner frequency equal to the symbol rate,
and have a flat frequency response up to a point, followed by the square root of
a cosine transfer function down to the limit of the stop band attenuation. The
rate of roll-off is defined in terms of a parameter just called
energy overshoots between
transitions, causing large envelope variations. A given schemes peak to average
ratio or “crest factor” can vary from 0 dB (FSK) to > 10 dB for QAM and
OFDM. If the IQ filter frequency roll-off is made “sharper” in order to
minimise adjacent channel power, then the peak to average power ratio increases.
Most QAM systems used “root raised cosine” filters on the I and Q channels.
These are designed to have a –3dB corner frequency equal to the symbol rate,
and have a flat frequency response up to a point, followed by the square root of
a cosine transfer function down to the limit of the stop band attenuation. The
rate of roll-off is defined in terms of a parameter just called
![]() , with smaller values indicating steeper roll-off, and corresponding increased
peak to average ratio.
, with smaller values indicating steeper roll-off, and corresponding increased
peak to average ratio.

The raised cosine filter has the property that it “rings” in sync with the symbol rate, and if the symbol is sampled at a certain critical instant, the filters distortion is avoided (a bit like being in the eye of a storm – lots of chaos outside the critical central spot, but no interference within)
The filtering is usually split evenly between transmit and receive paths, hence the (square) root raised cosine terminology. When the frequency response transfers of each are multiplied together, the overall raised cosine filter shape is obtained.
If
![]() a “brick wall” response is
obtained and the resulting over-shoot is excessive. However the utilised RF
bandwidth is at an absolute minimum. If
a “brick wall” response is
obtained and the resulting over-shoot is excessive. However the utilised RF
bandwidth is at an absolute minimum. If
![]() the cosine fall-off begins from DC,
resulting in a very “lazy” filter but very little overshoot. Most QAM
systems attempt to find an agreeable compromise between these two extremes. A
value of
the cosine fall-off begins from DC,
resulting in a very “lazy” filter but very little overshoot. Most QAM
systems attempt to find an agreeable compromise between these two extremes. A
value of
![]() is common.
is common.
|

This offer-shoot complicates the job of
RF power amplification, since most times the power amplifier is backed off
significantly from its point of best efficiency. Even without IQ filters the
minimum value is 1, the maximum is
![]() , indicating a large envelope variation for QAM64.
, indicating a large envelope variation for QAM64.
As attractive as the thin spectral profile of Digital Modulation formats may seem, the inaccuracies of the analog domain add flab to the hips. This increase in adjacent and alternate channel power is referred to as “spectral re-growth” caused by finite amplifier linearity. As the signal envelop expands and contracts, the RF power amplifier stages distort this amplitude variation, and also introduce phase perturbations on to the signal. In extreme cases, this distortion can destroy modulation accuracy, and in weaker cases, transport in band signal energy into adjacent channels.

To put this perspective, current state of the art Digitally generated modulation signals can readily achieve better than 70 dB rejection of energy spilling into adjacent and alternate channels. As much as 100 dB purity can be demonstrated from current high resolution DAC’s. Even the subsequent frequency conversion and small signal amplifying stages can preserve this spectral quality. However its not until we reach the RF Power Amplifier stages that we see levels of spectral re-growth that even Steven King would not dare to write of.
RF Power Amplifiers are usually described in terms of a “class of operation” and each “class” attracts certain attributes of behaviour. Typical classes in use are
Class A Highest Linearity Low Efficiency Small Signal, Low Power
Class AB Linearity OK for SSB Medium Efficiency Good Compromise For Power/Linearity
Class C Highly Non Linear Efficiency ~ 60% Constant Envelop FM Only
Higher Classes Highly Non Linear Higher Efficiency Low Frequency Application Only
A “Class A” RF Power amplifier will typically exhibit an output third order intercept point about 12 dB higher than its 1 dB output gain compression point. These amplifiers are generally well behaved and predictable, but need to operate well below their saturated output power capability if linearity is to be preserved. If QAM with an average power of Pav is produced from a Class A amplifier, the output ACP can be easily estimated.
Let us assume we have a Class A amplifier with a 1 dB gain compression output power of 10 watts, i.e. +40 dBm. Its IP3_Out will therefore be in the order of +52 dBm. For small output powers, its two – tone third order intermodulation product ratio will be given by
![]()
 …(12)
…(12)
The two-tone P3 products are a good
indicator of ACP performance under actual modulation conditions, at least for
Class A power amplifiers. In this example
![]() . This allows us to predict (using RMS output power as a variable)
. This allows us to predict (using RMS output power as a variable)
Pout = +40 dBm (10 Watts)
![]() - Note the amplifier will be in compression on peaks!
- Note the amplifier will be in compression on peaks!
Pout = +30 dBm (1 Watt)
![]() - Note – a lot less that the Digital ACP promise!
- Note – a lot less that the Digital ACP promise!
Pout = +20 dBm (100 mW)
![]() - Note – still shy of the –70 dB mark!
- Note – still shy of the –70 dB mark!
Pout = +17 dBm (50 mW)
![]() - Note – Just squeak in at –70 dB ACP!!!!
- Note – Just squeak in at –70 dB ACP!!!!
As can be seen, the penalty for Class A operation given PMR style specifications is extremely punitive. To meet a 70 dB acp MASK, We would need a 10,000 mW class A RF Power Amplifier just to let a measly 50 mW of RF “power” dribble out. The amplifier would require at least 20 Watts of DC power, and have an efficiency of only ¼ %.
This may seem like a fairly damning castigation of the seemingly “linear” Class A amplifier, but bear in mind, this is only relative to its application in a highly mature and ACP performance defined PMR application. The Type Approval specifications have evolved to reflect the performance capability of fairly mature FM technologies, and although spectrally inefficient, these are still relatively “spectrally clean”. Being “constant envelop” by nature, they do not suffer ACP degradation when passed through non-linear RF power amplification stages.
In contrast, microwave data link modems use Class A rf power amplifiers because the rules for ACP are relaxed to suit the point to point and reduced power application. As little as –32 dB ACP can be tolerated for ETS-300-633 for example, which places Class A RF Power Amplication at the top of the shopping cart.
Still we are high on the heels of PMR and ACP linearity. The second “Class AB” category is calling our attention. This boasts a compromise between efficiency and linearity – perhaps some salvation can be sought in the Class AB domain?
Unfortunately most Class AB RF Power amplifiers stagnate at around 35 dB of intermodulation rejection, and this ratio improves slowly as output power is reduced. They can even show non monotonic dips down to –50 dB at certain critical output powers, but these often are at the expense of additional power cast further out.
So we are left in a quandary. Sure the Digital modulation formats have clean slender sides, but the practicality of real world RF power amplification soon makes a mockery of this. The promise of -100 dB skirts quickly drapes out to –35 dB when the RF PA clicks in.
The available RF component technology of today is the weak link of the Digital chain. Little can be done to improve on the laws of physics, instead we need to apply linearity enhancement mechanisms.
The standard principles of negative feedback used in almost all audio amplifier and Op-Amp applications can also be applied to RF amplifiers. However it is only really usefull in Class A applications, where the small signal gain is relatively constant over the RF signal swing. In Class AB applications, negative feedback is only effective when the device is “on”, however for 50% of the time it is “off” and therefore the application of negative feedback to a zero gain amplifier is meaningless.
The series – shunt configuration is common used, especially in MMIC design.
|
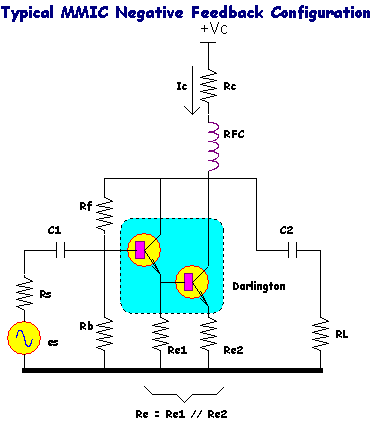
There are however some cautionary messages on negative feedback. First, the device in question must have an operating bandwidth far beyond that of the immediate application. With 70 GHz (SiGe) devices in a MMIC configuration this is easy-peasy. However high power devices often have only enough gain to do the job as it is, so excess gain required for negative feedback may not be available. In addition, negative feedback has only a small effect on output IP3, as would be important for a RF power amplifier stage required to deliver actual RF output power. For example, if a given stage has negative feedback applied, and the amount of feedback is increased so as to reduce the power gain by 3 dB, the output third order intercept point may only increase by 0.5 dB, and the input by 3.5 dB! Negative feedback therefore favours small signal applications such as low noise amplifiers for receiver applications.
If a given RF Power amplifier has characteristics that are stable over time, then an equal but opposite distortion can be supplied to its input in order to counteract its own non linearity. This “pre-distortion” can be generated by analog methods, but the most effective solution is to generate the compensation digitally on I and Q modulating signals.
Pre-distortion can be expected to yield ~20 dB of ACP improvement without serious effort, and ~35 dB if exact conditions on frequency, temperature and supply voltage are known. This regime requires extensive Factory calibration however, and performance degradation of RF power devices over time cannot be compensated for. Pre-distortion is therefore an “open loop” linearisation technique. It is useful to add value to an existing design, but may not be the best choice to enhance a design far beyond its basic capability.
With Negative Feedback we take a version of the amplifier’s output signal, compare it with the input on an instantaneous time by time basis, and generate an error signal that drives the RF amplifying device. However if the device is slow, the cumulative phase shift it causes can result in instability. In addition, if it is bandwidth limited, then information contained in harmonics (i.e. the distortion) may not be successfully fed back.
Feed-forward techniques avoid this problem by comparing input and output signal profiles, generate an error signal and then apply this correction after the RF power device. This represents a cancellation approach, rather than some basic means to iron out the overall transfer characteristic in the first place.
Feedforward linearistion has been applied to multiple carrier RF power amplifiers used in CATV signal distribution systems and some GSM applications. The best offering’s today boast 70 dB of intermodulation performance. However the price paid is the inefficient means of adding the error corrected power to the output, and a “slave” amplifier is required to perform this task. This amplifier, working on the error signal, has to be exceptionally linear so as not to add artefacts of its own!. In addition, being a cancellation technique, the overall system is highly sensitive to various stage gains, and as might be expected, requires some additional tweaking over various operating conditions.
This is an intelligent modification on the theme of negative feedback. However rather than applying this feedback directly at RF, this time it is applied only to the IQ modulation domain.
The basic idea is to generate IQ modulating signals, which are then frequency up-converted to the desired RF frequency. These are amplified by arbitrary RF power amplifiers stages. The output is sampled and then frequency down converted to I and Q signals. These are compared to the original I and Q signals and an error signal is generated. This error signals drives the RF amplifier so that input and output I and Q signals are identical.
This is just a sum of all possible squared-magnitudes divided by the total number of points,
|
![]()
The average symbol power can be defines as,
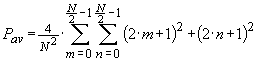 ...(13)
for
![]() . Some example constellation statistics are included in the following table.
Note that these are independent of whether direct QAM or OFDM is used.
. Some example constellation statistics are included in the following table.
Note that these are independent of whether direct QAM or OFDM is used.
Table 1 – Example Constellation Statistics
|
|
|
|
|
Maximum Symbol |
Minimum Symbol |
Format |
|
2 |
4 |
2 |
1.414 |
1 + j |
1 + j |
QPSK |
|
4 |
16 |
10 |
3.162 |
3 + 3j |
1 + j |
QAM16 |
|
6 |
36 |
23.333 |
4.830 |
5 + 5j |
1 + j |
QAM36 |
|
8 |
64 |
42 |
6.481 |
7 + 7j |
1 + j |
QAM64 |
|
16 |
256 |
170 |
13.038 |
15 + 15j |
1 + j |
QAM256 |
Now the ICI ratio is relative to this average power, and when the absolute errors exceed +/-1 a decision error occurs. Consequently large constellations need low values of ICI for successful demodulation.
The RMS noise power is equivalent to the
variance of the noise, i.e.
![]() where
where
![]() equals one standard deviation for a
normal distribution.
equals one standard deviation for a
normal distribution.
|

So far we have found expressions for ICI
= -SNR in dB, but in our case
![]() . For the symbol to be correct, both real and imaginary terms must be correct.
. For the symbol to be correct, both real and imaginary terms must be correct.
|
If we focus on 2 standard deviations as
a benchmark, the probability that both real and imaginary components will be
correct will be
![]() and the corresponding corrected BER
will be
and the corresponding corrected BER
will be
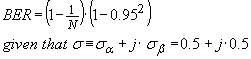 ...(14)
Since the noise is evenly distributed
between real and imaginary axis, the actual value of
![]() will be 3 dB higher so the
corresponding SNR for this BER will be
will be 3 dB higher so the
corresponding SNR for this BER will be
![]() ...(15)
...(15)
We can now make some predictions for SNR and BER tradeoffs between different constellations.
Table 2 – Example SNR = -ICI Estimates
|
|
|
|
|
BER Limit |
SNR @ BER |
Format |
|
2 |
4 |
2 |
1.414 |
4.9 % |
6 dB |
QPSK |
|
4 |
16 |
10 |
3.162 |
7.3 % |
13 dB |
QAM16 |
|
6 |
36 |
23.333 |
4.830 |
8.1 % |
16.7 dB |
QAM36 |
|
8 |
64 |
42 |
6.481 |
8.5 % |
19.2 dB |
QAM64 |
|
16 |
256 |
170 |
13.038 |
9.1 % |
25.3 dB |
QAM256 |
It can be shown from Bessel theory that for small phase perturbations we have,
![]() ...(16)
...(16)
The
MINICIRCUIT’s JT0S-3000 VCO has
![]() For a nominal IF Bandwidth of 100
kHz the residual FM will be
For a nominal IF Bandwidth of 100
kHz the residual FM will be
![]() (rms). This will increase to 791 Hz
for a nominal IF bandwidth of 5 MHz. The static frequency error for 0.1 ppm
frequency accuracy will be 250 Hz at 2.5 GHz in comparison.
(rms). This will increase to 791 Hz
for a nominal IF bandwidth of 5 MHz. The static frequency error for 0.1 ppm
frequency accuracy will be 250 Hz at 2.5 GHz in comparison.
Direct QAM systems are very prone to frequency errors and can be analysed in terms of the total average phase noise power being represented as an additive term. This suggests the following integral,
![]() ...(17)
...(17)
based on a typical VCO phase noise falling at –6 dB per octave (usually valid for offsets between 1 kHz and 1 MHz). However the low frequency limit has greatest affect on the total integrated power, not the IF bandwidth as in the case of OFDM. Expressing equation (24) in dB suggests,
![]() ...(18)
...(18)
In general,
![]() will be determined from the
frequency synthesiser loop bandwidth (acts as a high pass transfer
characteristic) or from the message length i.e.
will be determined from the
frequency synthesiser loop bandwidth (acts as a high pass transfer
characteristic) or from the message length i.e.
![]()
Table 3 – Effect of Phase Noise and Bandwidth on Direct QAM SNR
|
Format |
Message Time |
|
Phase Noise |
Offset |
QAM SNR |
OFDM ICI Comparison |
|
QAM16 |
160 us |
6.25 |
-92 dB |
10 kHz |
-50 dB |
-29.7 dB |
|
QAM16 |
2.56 ms |
0.39 |
-92 dB |
10 kHz |
-37.9 dB |
-5.7 dB |
|
QAM16 |
3.2
us |
312.5 |
-92 dB |
10 kHz |
-66.9 dB |
-46.7
dB |
|
QAM16 |
51.2
us |
19.5 |
-92 dB |
10 kHz |
-54.9 dB |
-22.7
dB |
Note that under similar operating conditions, QAM phase noise susceptibility is far superior to OFDM by a factor ~20 dB !
![]()
Return to: System Analysis
or: Ian Scotts Technology Pages
© Ian R Scott 2007 - 2008